AI Feedback Intelligence Tool
Simplifying Complex Customer Feedback with Gen AI


OVERVIEW

As a UX designer focused on scalable enterprise solutions, I led the design of an internal AI-powered tool that automated how Vanguard teams analyze customer feedback.
Previously, teams had to manually review over 1,000 feedback entries per week—an inefficient and error-prone process.
FINAL PRODUCTS

The system doesn’t replace decision-makers. It amplifies them. AI handles the heavy lifting - scanning, organizing, and prioritizing - while humans stay in control of context, trade-offs, and final calls.


FINAL PRODUCTS
What once took entire research teams days to process is now completed in seconds. The AI automatically organizes and summarizes feedback, allowing teams to spend less time sorting data and more time acting on it.
FINAL PRODUCTS
Ask Questions, Not Dashboards
This is not another dashboard. There are no rigid filters or predefined views to manage. Teams ask questions naturally and follow the signal where it leads, moving from raw feedback to insight without getting stuck in configuration or setup.

THE PROBLEM

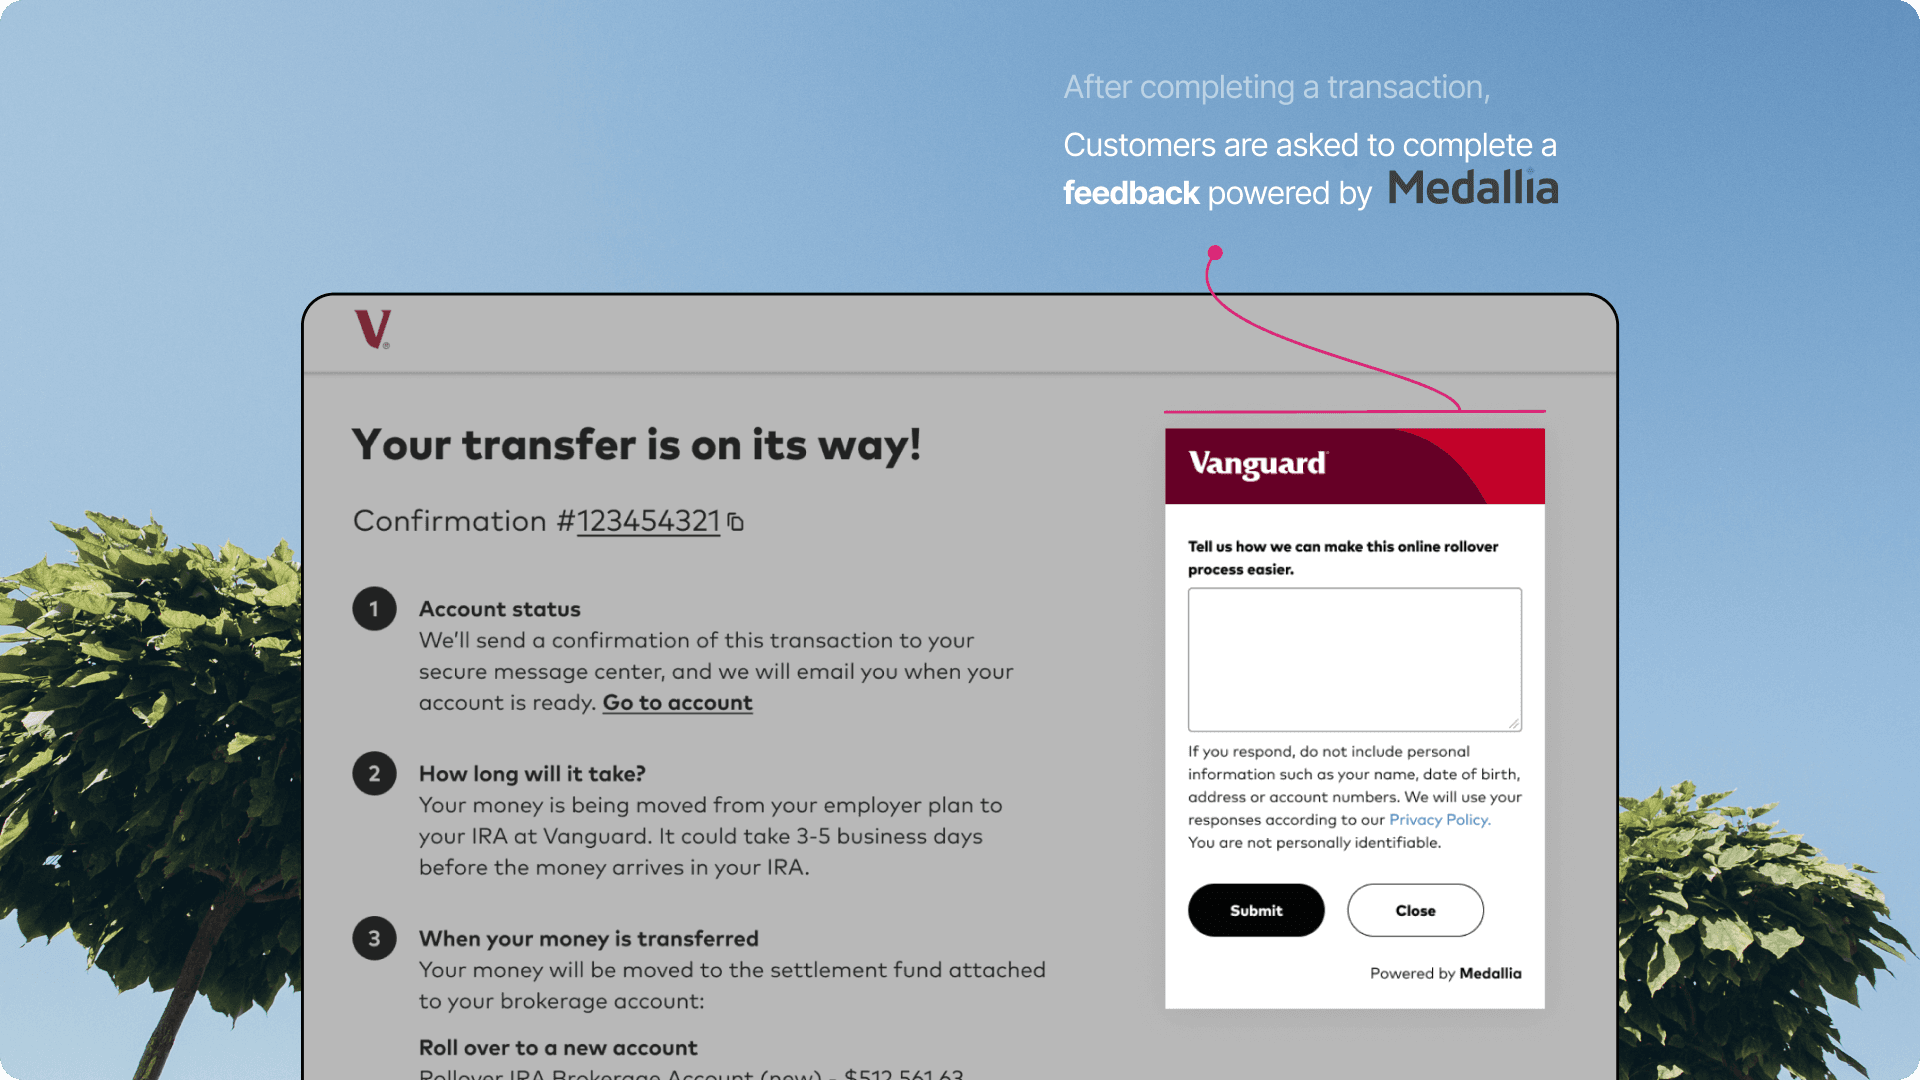
Vanguard saw a sharp rise in customer feedback as rollover transactions surged—jumping from 13,000+ in 2022 to 30,000+ in 2024. Alongside this, monthly feedback entries grew from just 200+ to over 1,000.
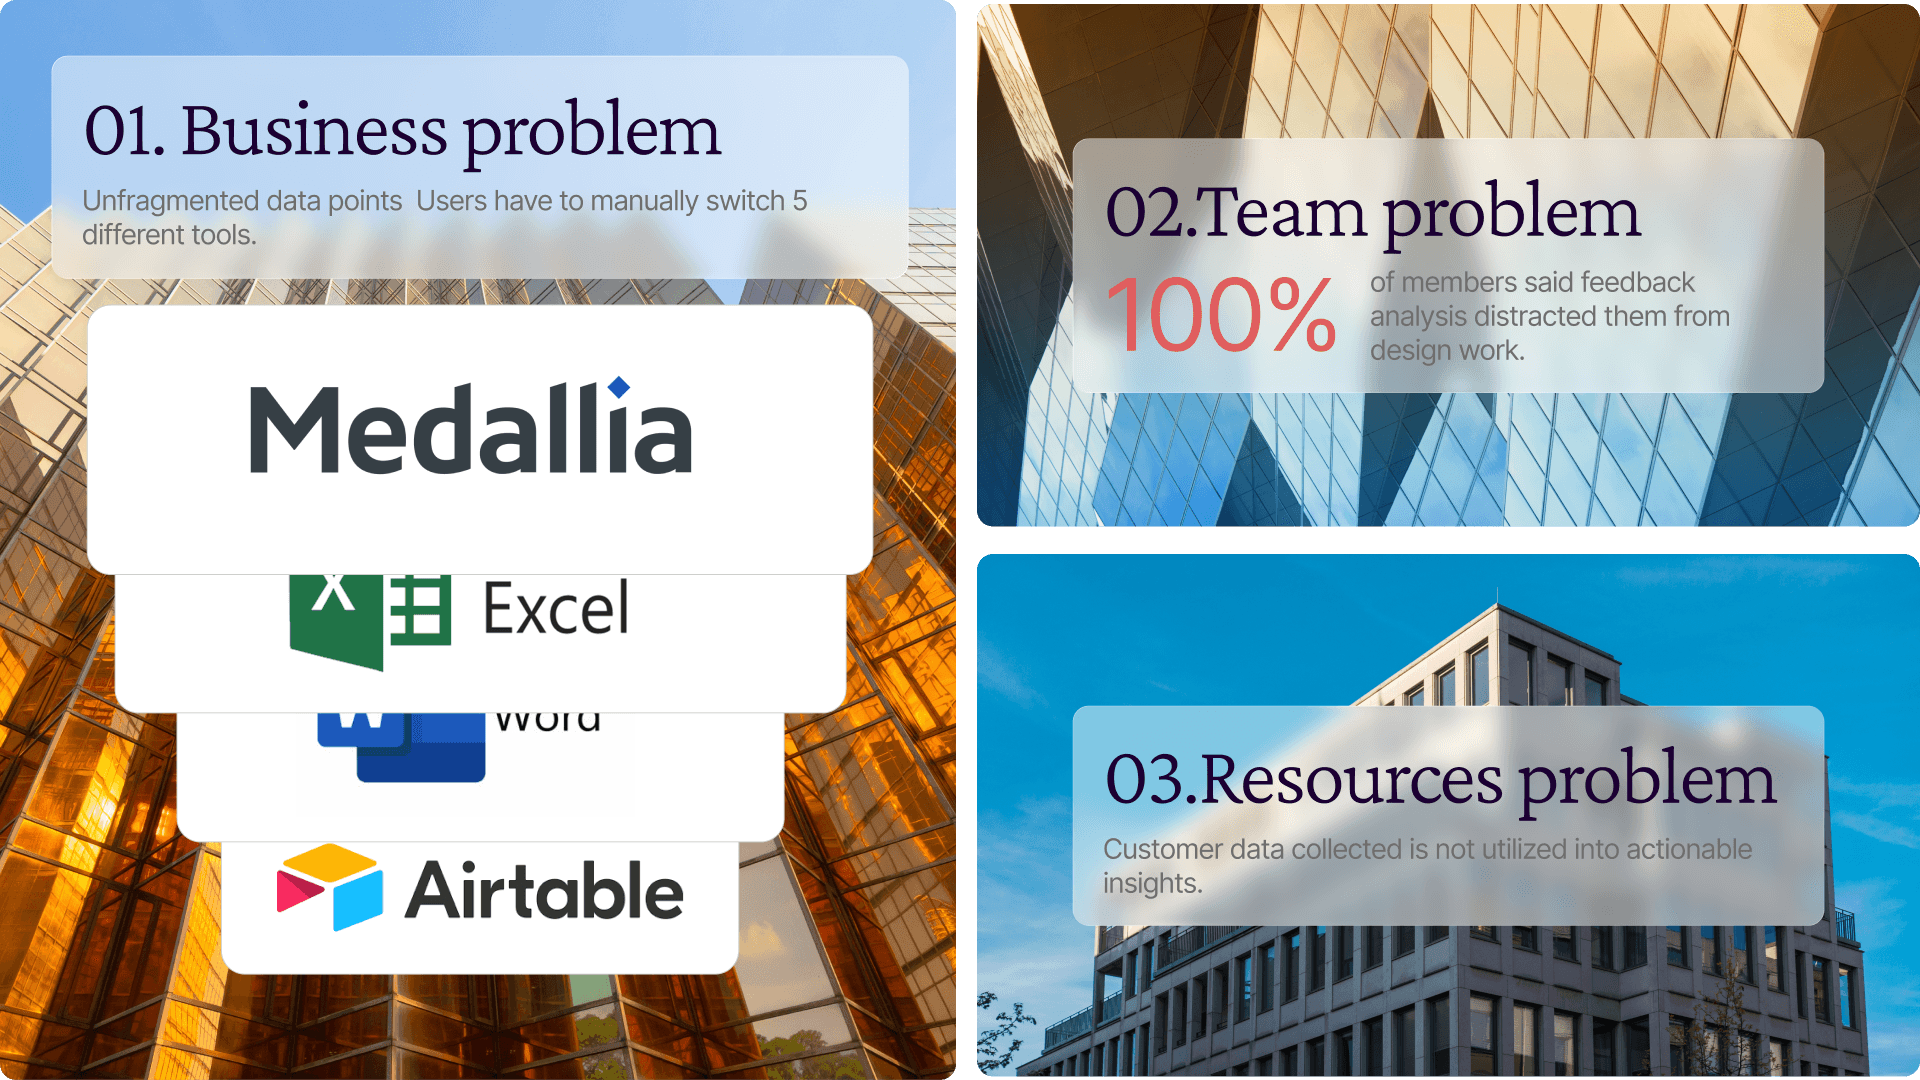
The existing process required teams to manually sift through every comment, which:
Consumed hours of effort each week
Left most feedback unread or undocumented
Delayed discovery of urgent issues like broken features
Limited the company’s ability to act quickly on user needs
In short, the more transactions we processed, the more unmanageable the feedback became—overwhelming teams and stalling meaningful action.
AI DESIGN

DESIGN AI
I worked with engineers to turn raw feedback into clear, traceable insights. Here’s how a customer comment becomes a useful design input.
From feedback to interface.
Customer feedback
“I like to see and fill in all the information on the SAME PAGE!”
Original feedback
The redesign was a joke, as you already know. We need an optimized, data-driven view of our financial assets, not to have our hands held with pretty flashy graphics. I miss the old clunky website if that tells you how bad the redesign is!!! Wow. Less separated menus. I like to see and fill in all the information on the SAME PAGE!


Design response

The iterations
Sketches
Wireframes
Final
KEY FEATURES
Start with the overall picture, then inspect the feedback behind it.
The dashboard
DESIGN ITERATIONS

Two decisions shaped the dashboard: how people scan the information, and what we could build with the existing system.
Follow the Z.

Moving the map and history gives the dashboard a Z-shaped reading order.
Use what we already had.
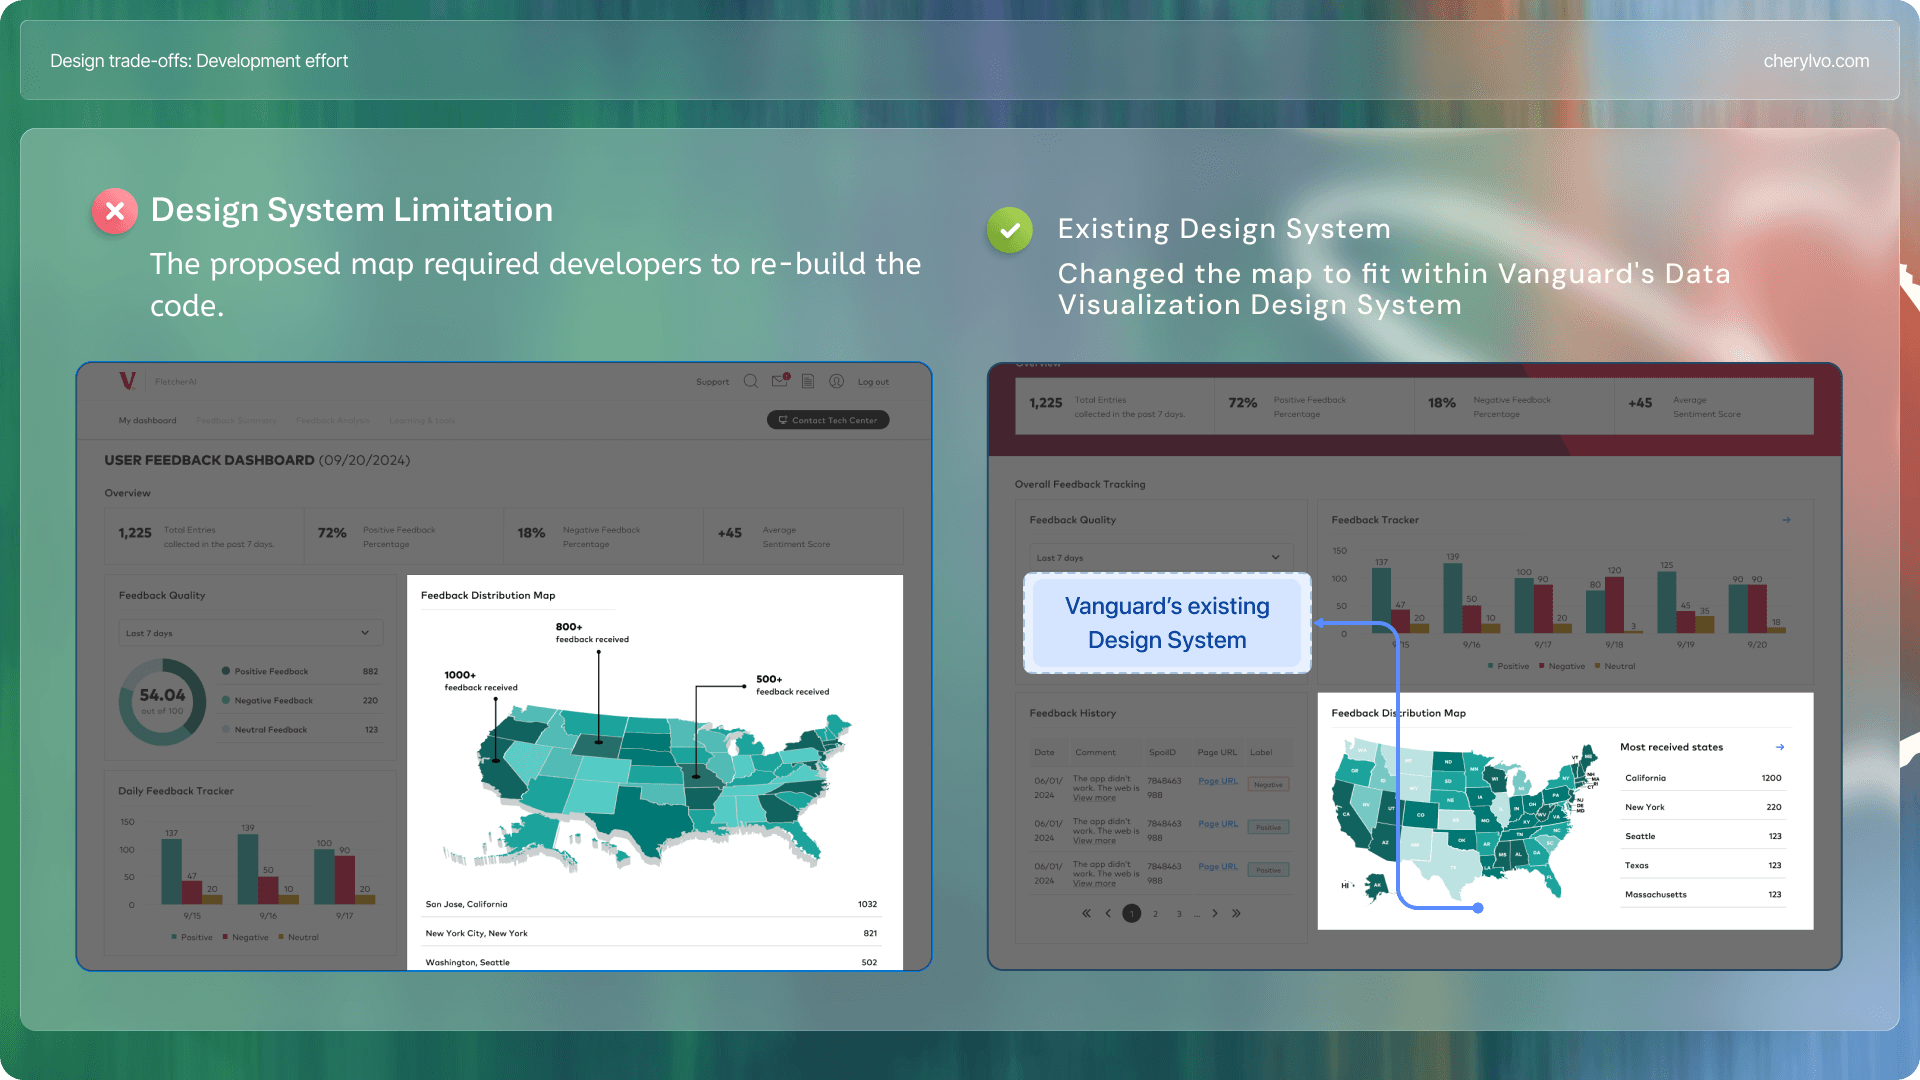
I adapted the map to Vanguard’s existing data visualization system.
THE SOLUTION

To address the overwhelming volume of feedback, I led the design of an AI-powered tool that automates the end-to-end analysis process. Working cross-functionally with engineers and strategists, I mapped out the data pipeline, prioritized user pain points, and created a streamlined interface that enables teams to extract insights in real time.
The tool was built to adapt to different team workflows, helping them surface trends, monitor sentiment, and act quickly on what matters most.

FINAL PRODUCTS
The final product of the tool inspired my passion in solving complex real-world problems with the combination of Data and AI. Data is the future, and by automating this manual process, I learn to deliver products that not only improved operational efficiency, but also help business understand their product metrics, users' needs and expectations.

Improving efficiency and streamlining the feedback analysis process
Empowering stakeholders with timely and actionable insights
Enabling Vanguard to make informed decisions that aligned with user needs


